Making Your Power BI Teams More Analytic with Microsoft Fabric - Static Analysis for Reports
In my last article, I demonstrated how to set up an Azure DevOps pipeline that detects changes in Power BI reports and publishes the PBIP files as artifacts within the pipeline (not to a workspace). Now, with these artifacts available, we can trigger additional pipelines to analyze, monitor, and review our Power BI reports and semantic models.
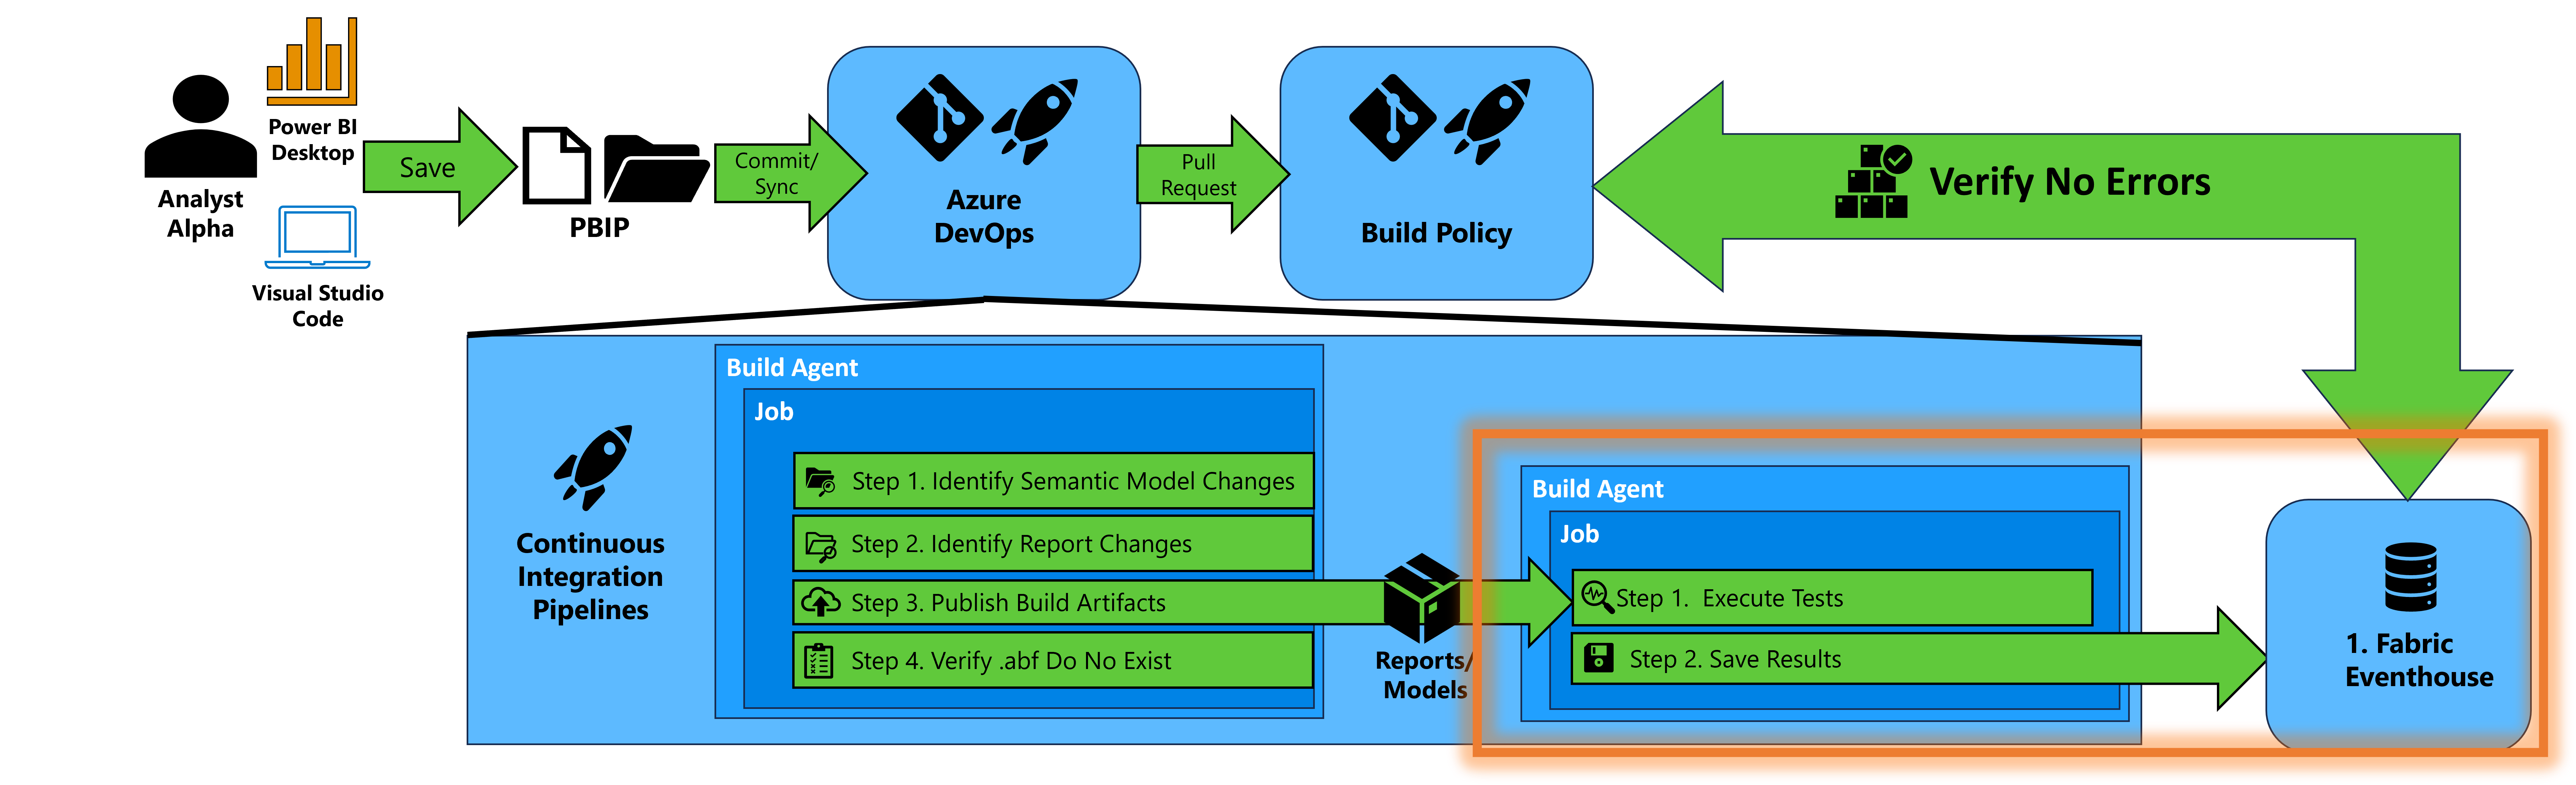 Figure 1 – High-level Diagram of analyzing reports with PBIR Inspector and storing results
As shown in Figure 1, we’ll focus on the lower-right and set up the technology to accomplish two key steps:
Analyzing reports with PBIR Inspector – PBIR Inspector, developed by Nat Van Gulck, examines the PBIR file format (which defines a Power BI report’s structure and behavior) for issues based on predefined rules. It offers both a User Interface and a Command Line Interface (CLI). If you’re looking to standardize how your reports are built, this is a vital tool to apply rules and capture results. When you import the repository in the instructions below, you’ll import the CLI and the predefined rules files. Feel free to update the rules file located in the “Rules” folder as you see fit.
Storing the analysis results – To track improvements over time, we need a place to store our results, aggregate analyses, and generate metrics. But where? This is where Real-Time Analytics comes into play. In 2024, Microsoft introduced the ability to create an Eventhouse, a Software-as-a-Service (SaaS) form of Azure Data Explorer (Kusto). Eventhouses are part of the Real-Time Analytics component of Microsoft Fabric and fit perfectly with our need to log test results quickly and allow for near real-time actions (e.g., like knowing when a critical test fails before your customer is impacted).
Key Azure Terms
Before configuring storage, let’s clarify some Azure terminology used in this guide:
- Service Principal – An identity used by applications or automation tools to securely access Azure resources without user interaction (similar to a service account).
- Client Secret – A password-like credential paired with a Service Principal to authenticate and access Microsoft services. It must be stored securely and updated periodically.
- App Registration – The process of creating an identity for an application in Azure Active Directory (AAD)/Entra to enable authentication and resource access via APIs.
- Variable Group – A centralized collection of variables in Azure DevOps that can be shared across pipelines, useful for managing configurations and securing sensitive values.
- Pipeline Trigger – Just like our first pipeline runs on a Git commit, we can trigger another pipeline when a new artifact is created.
Jargon aside, we’ll now go over how to set up the platform to save PBIR Inspector’s results.
Prerequisites:
You can create a Fabric Workspace. Instructions are provided at this link.
You have a service principal. If you are using a service principal, you will need to make sure the Power BI tenant allows service principals to use the Fabric APIs. The service principal will need at least the Member role to the workspace.
Retrieve the Pipeline ID for the PBIP-CI pipeline created in the prior article. If you navigate to the pipeline and in the URL you’ll see a query string parameter labeled “definitionId”. Copy the numeric value for later.
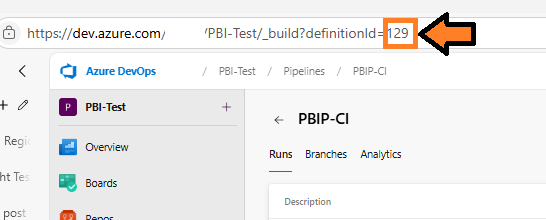 Figure 2 – Copy the Pipeline ID
Create an Azure DevOps Personal Access Token by following these instructions. The PAT Token should have a Custom defined scope with the following options checked:
- Read for the Build
- Read for Code
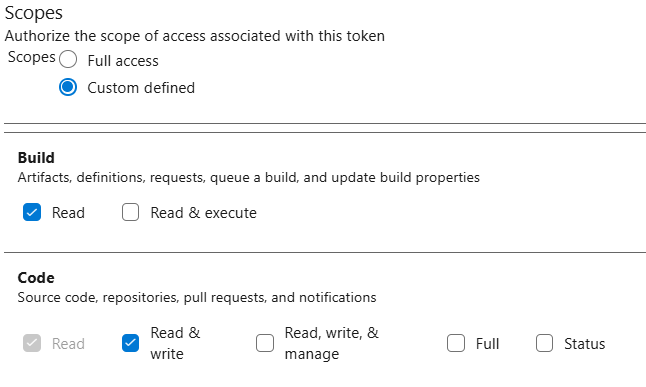 Figure 3 – Set Scopes for the PAT
Copy the token for later.
Steps:
1. Import Repository
- Navigate to Repos, click the breadcrumb menu dropdown (chevron), and select Import.
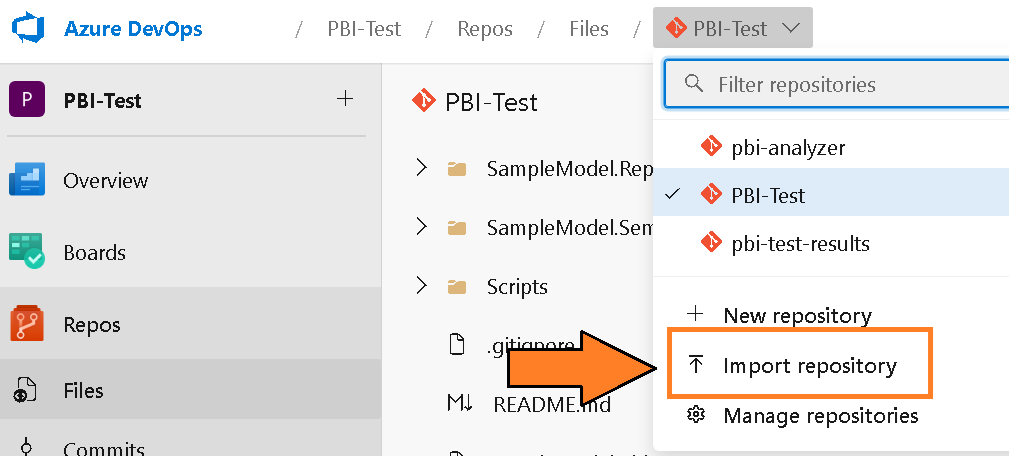 Figure 4 – Import repository
 The “Import a Git repository” window should appear. Enter “https://github.com/kerski/pbi-teams-more-analytic-support” into the Clone URL field and select the import option.
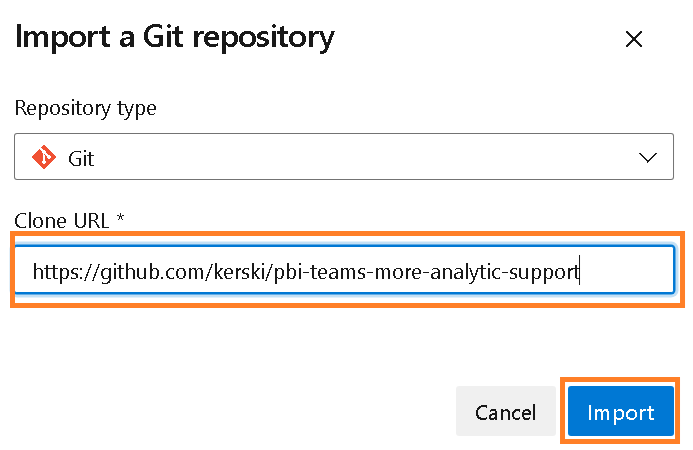 Figure 5 – Import a Git repository
Once the Import button is selected, the import process will begin and could take a few minutes.
 Figure 6 – Example of importing Git repository from GitHub into Azure DevOps
Once completed, you’ll see the repository imported.
2. Set up Git Integration
Navigate to the Fabric workspace you created in the Prerequisites section and select Workspace settings.
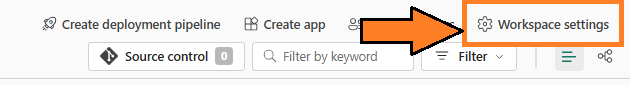 Figure 7 - Select Workspace Settings
Select the “Git Integration” option.
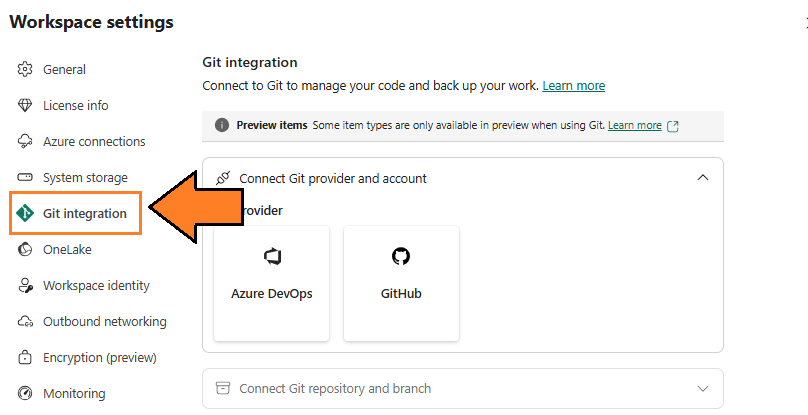 Figure 8 - Select Git integration
Then select the “Azure DevOps” option.
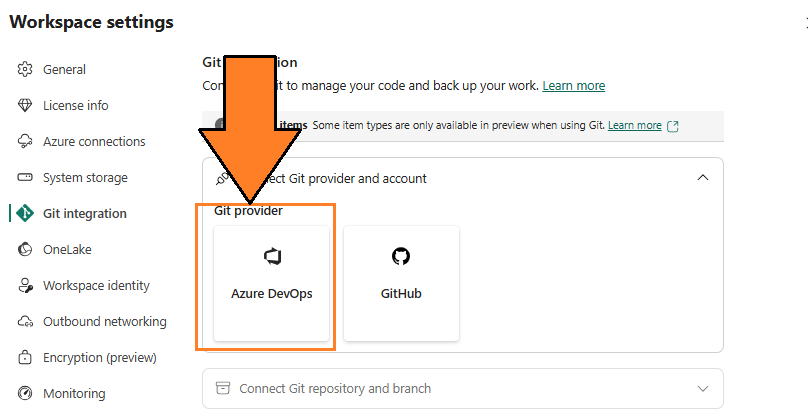 Figure 9 - Select Azure DevOps option
Then select the “Connect” option.
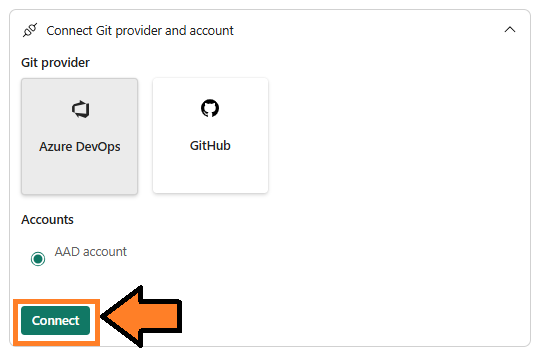 Figure 10 - Select Connect option
Then fill out the form as follows:
- Organization – The organization associated with the Azure DevOps project.
- Project – The project where you imported the repository in the prior section.
- Git Repository – The name you gave the repository you imported in the prior section.
- Branch – Select “eventhouse”.
- Git folder – Enter the word “Artifacts”.
Then select the “Connect and sync” option. It may take a few minutes for all the artifacts to load into the repository. 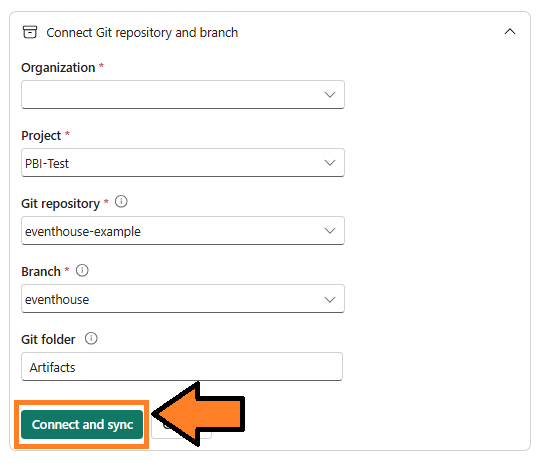 Figure 11 - Select Connect option
When the sync has completed, you will see the Eventhouse and KQL Database created called “EH_MYPBITMA”.
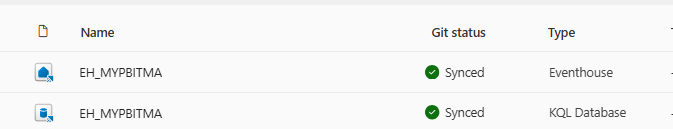 Figure 12 - Select Connect option
Select the KQL Database named “EH_MYPBITMA”.
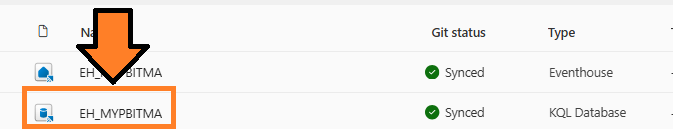 Figure 13 - Select KQL Database
You will be presented with an overview page for the KQL Database. Select the “Copy URI” option for the Query URI field located in the Overview. This is also referred to as the Cluster URL and is the address for the KQL Database. Save this URI for the next set of instructions.
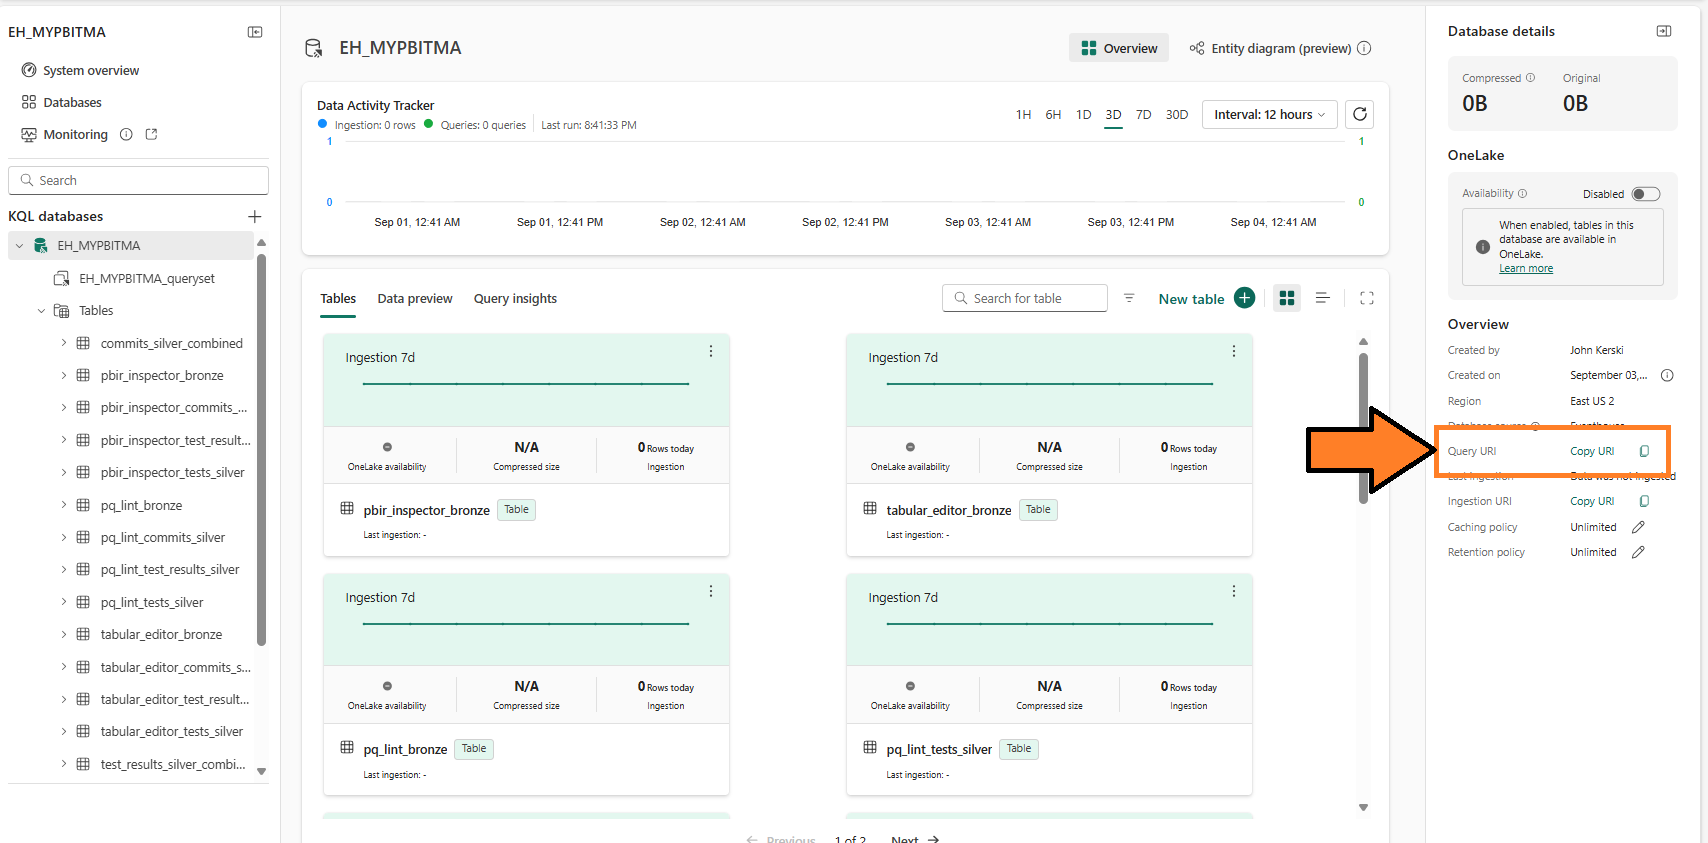 Figure 14 - Copy Query URI
3. Set up the Variable Group
- In your Azure DevOps project, navigate to the Pipelines->Library section.
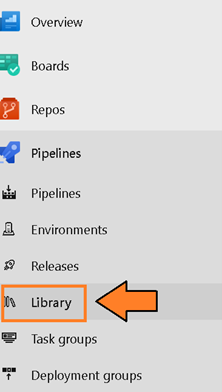 Figure 15 – Select Library
 - Select the “Add Variable Group” button.
 Figure 16 – Select + Variable Group
 - Create a variable group called “MYPBITMA-EVENTHOUSE” and create the following variables:
- ADO_TOKEN – This is the PAT Token copied in the prerequisites section.
- UPSTREAM_PIPELINE_ID – This is the pipeline ID copied in the prerequisites section.
- TENANT_ID – This is the unique identifier for your Microsoft 365 tenant. This can be found by using these instructions.
- CLIENT_ID – This is the unique identifier for the service principal you created to save tests to the Eventhouse.
- CLIENT_SECRET – This is the “password” for the service principal, so you should set the lock icon so it’s encrypted and not visible in plain text.
- CLUSTER_URL – This is the URI (Query URI) you copied in the prior step.
- DATABASE – Enter “EH_MYPBITMA”.
Save your changes.
4. Set up Pipeline
Now we can set up the pipeline to run in Azure DevOps when artifacts are published.
- Navigate to the Pipelines screen.
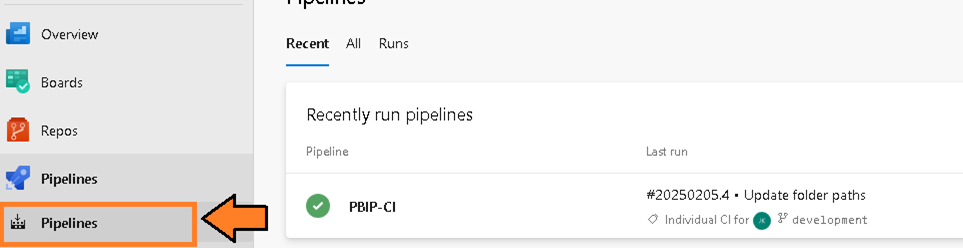 Figure 17 – Navigate to the Pipelines screen
 - Then select the “New Pipeline” button.
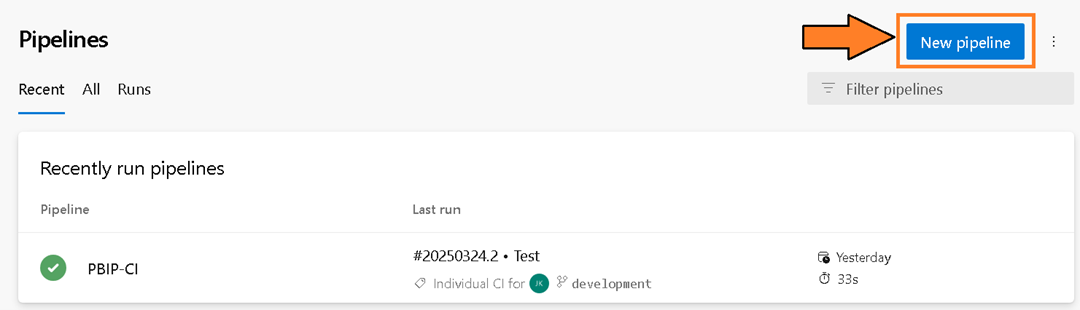 Figure 18 – Select the “New pipeline” button
 - You will be presented with the question “Where is your code?”. Select the Azure Repos Git option.
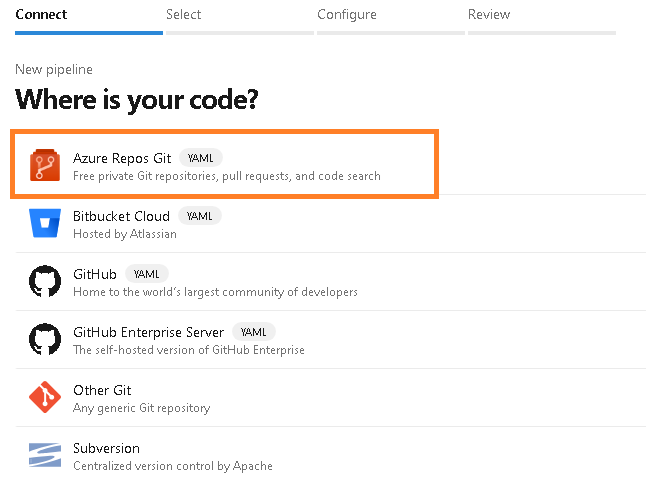 Figure 19 – Select the Azure Repos Git option
 - You will be prompted to select a repository. Select the repository name “pbi-teams-more-analytic-support”.
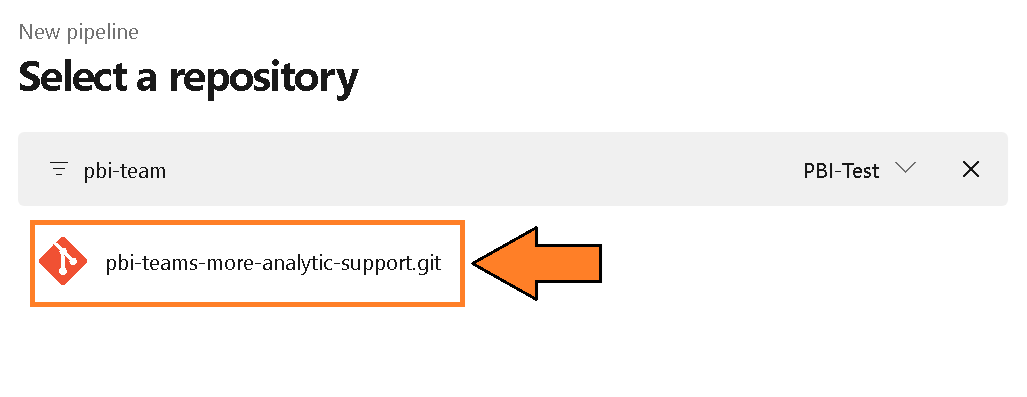 Figure 20 – Select a repository
 - You will be prompted to configure your pipeline. Choose the “Existing Azure Pipelines YAML file” option.
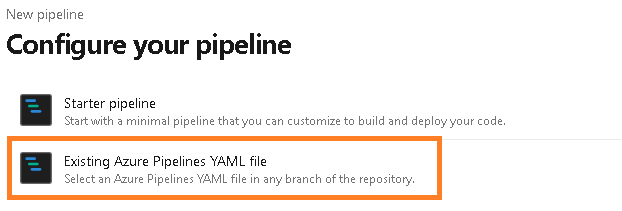 Figure 21 – Configure your pipeline
 - From the “Select an existing YAML file” select the Branch “eventhouse” and the Path named “pbir-inspector-eventhouse.yml”. Press Continue.
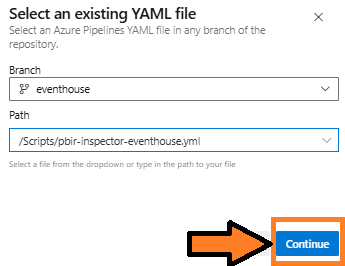 Figure 22 – Select pbi-inspector-eventhouse.yml
 - Update the project names (line 32 and 84) to reference the project name.
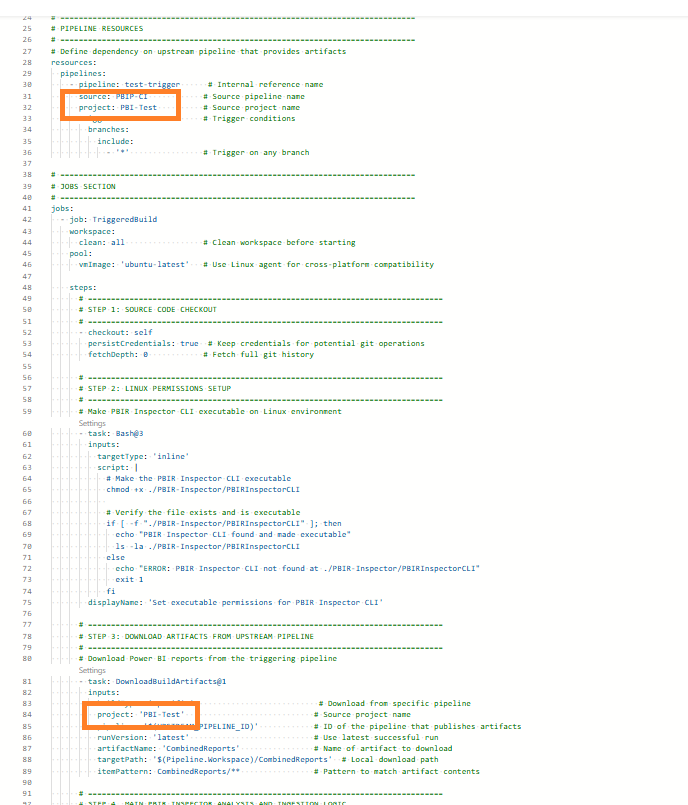 Figure 23 – Update project references
 - Then select the “Run” button and this will kick off the pipeline.
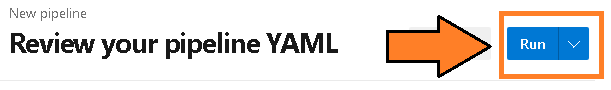 Figure 24 – Select “Run” Button
 - You will be redirected to the pipeline screen and prompted to verify permissions. This is because the variable group is a resource that requires explicit access for the pipeline. This security measure (a good one) prevents inadvertent access to variables in the group. Click View to proceed.
 Figure 25 – Select the “View” button
 - You will be asked to permit the pipeline to access the variable group you created in the prior steps. Select the “Permit” button.
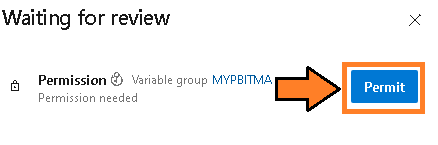 Figure 26 – Select the “Permit” button
 - You may be prompted again to permit. Select the “Permit” button.
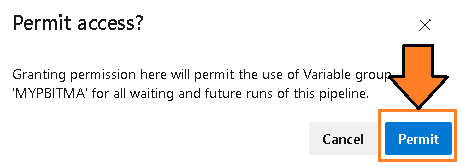 Figure 27 – Select the “Permit” button again
 - This will officially kick off the pipeline and it will access the last published packages from the PBIP-CI pipeline.
 Figure 28 – Pipeline trigger
 - When the pipeline completes, verify there are no errors, and you can check the Eventhouse to see if PBI Inspector’s analysis has been saved to the bronze table.
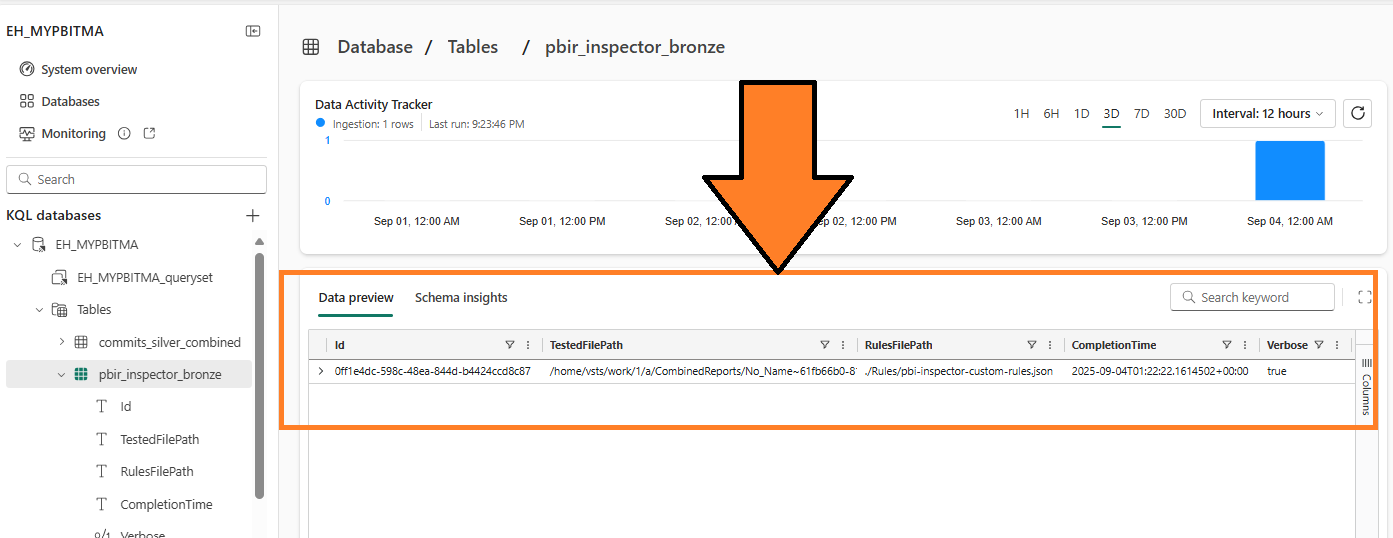 Figure 29 – Example of files saved to Eventhouse
 - I would recommend renaming the pipeline from the default to “pbir-inspector”. Instructions for renaming a pipeline can be found at this link.
Potential Issues
If you see errors in your pipeline, verify that your service principal has Member rights to the workspace and also verify that the Query URI for the Eventhouse is correct. I have also seen that if you recently created the Eventhouse, you may get a 520 HTTP error in the pipeline. Re-run the pipeline again and the data should be saved (it seems like you have to ‘prime’ the pipeline).
Also, tests will only run on report changes. If you’re making changes to the semantic model, this pipeline will not save any test results because no tests will be executed.
Conclusion
Hopefully, this guide helped you successfully save your PBIR Inspector analysis results. Now, you’re ready for the next chapter in this series, Semantic Model – Static Analysis. Stay tuned…
As always, let me know your thoughts on LinkedIn or Twitter/X.