Automated Testing for Broken Visuals with Microsoft Playwright
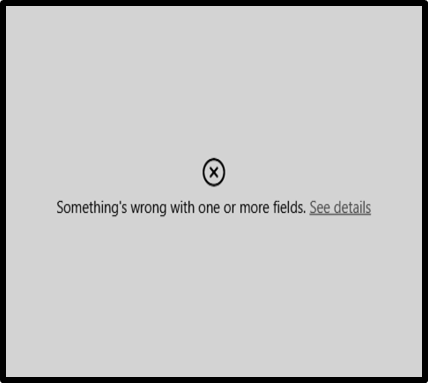 Figure 1
This image plagues my dreams, a grey box of death that can infect my projects and diminish my team’s capacity to maintain trust.
Overly dramatic? Maybe, but theatrics aside, a broken visual in a report is the most obvious sign of how well (or not) your project manages deployments. I’ve seen presentations go south and been on the receiving end of an annoyed phone call due to a recent update to a semantic model.
And while I could automate many tests for semantic models, I still couldn’t be sure that those changes didn’t negatively impacted the reports that relied on the models. Furthermore, broken visuals are not always a result of changes to semantic models. From this list of errors, here are just a few I’ve encountered:
Power BI visuals have been disabled by your administrator - If your Power BI tenant admin has decided to disable these settings either accidentally or deliberately due to a policy change, you could suddenly have broken visuals.
This visual has exceeded the available resources - Under certain conditions, the visual’s DAX could be taxing on the model, or the capacity running the report is being heavily utilized, causing you to hit an unforeseen limit.
Couldn’t retrieve the data for this visual – If you’re relying on Direct Query and the gateway or cloud data source goes offline, this type of broken visual can appear.
Data shapes must contain at least one group or calculation that outputs data - Similar to the prior issue, the data source may be available, but it has no data to provide. I’ve seen this occur with an empty dimension table due to a loading issue.
To avoid a broken visual, I’ve seen teams nominate a ‘lucky’ team member to check the reports once or twice a day. This meant they had to go to each workspace, navigate to each report, and then check each page. Tedious, right? Now, what if your semantic model is using Row-Level (RLS) or Object-Level security (OLS)? Multiply the number of checks by the number of roles, and your ‘lucky’ team member will be spending a lot of time performing those checks.
So, how do we ensure that the ‘grey box of death’ doesn’t creep into our work without the drudgery of manually checking each visual? In DataOps, we emphasize the automated detection of issues through the principle of ‘Quality is Paramount.’
Quality is Paramount: Analytic pipelines should be built with a foundation capable of automated detection of abnormalities (jidoka) and security issues in code, configuration, and data, and should provide continuous feedback to operators for error avoidance (poka yoke).
Microsoft Playwright enters the room
In the past, I had teams use various end-to-end testing tools to try to automatically test for broken visuals, with varying degrees of success. However, recently I was introduced to Microsoft Playwright and came across an article by Avi Ulman about testing Power BI using Playwright. Microsoft Playwright is an open-source automation library for browser testing that was launched in January 2020. There is a wonderful YouTube channel that dives deep into the tool, featuring great tutorials by Microsoft’s Debbie O’Brien.
Generating Test Cases
Inspired by the technology and the article, I collaborated with Prachiti Jadhav to establish a template that allows teams to test for broken visuals in a repeatable pattern. The basic concept is that if we could feed a CSV document of test cases to Playwright, we could identify the reports, pages, and roles we want to test across various Power BI implementations. This CSV would contain the following columns:
test_case - A unique name for the test. We include the report URL to make referencing easier.
workspace_id - The GUID for the workspace.
report_id - The GUID for the report.
page_id - The GUID for the specific tab in the report.
dataset_id - The GUID for the semantic model. This is a required field if the semantic model is using RLS/OLS.
user_name – The universal provider name (e.g., email address) for the user if the semantic model is using RLS/OLS.
role – The role name to test. This is a required field if the semantic model is using RLS/OLS.
Thanks to Prachiti’s efforts, this is now an open-source PowerShell module that will generate this CSV for you (see the code snippet below). I should also note that we made sure it works for our GCC colleagues as well.
Get-PowerBIReportPagesForTesting -DatasetId $variables.TestDataset2 -WorkspaceId $variables.TestWorkspace2 `
        -WorkspaceIdsToCheck @($variables.TestWorkspaceToCheck2) ` -Credential $Credential `
        -TenantId "$($variables.TestTenant)" `
        -LogOutput "Table" `
        -Environment Public `
        -Path $testPath1
You could also manually generate a CSV yourself, but the PowerShell module allows for a high-degree of automation.
Playwright takes center stage
With the CSVs in place (specifically in a test-cases folder), we could instruct Playwright to render a report in a browser using the powerbi-client package. This technique required us to leverage a service principal, incorporate some OAuth code in TypeScript, and use JavaScript Promises to detect whether the report page had a broken visual. Figure 2 provides a high-level representation of the testing process.
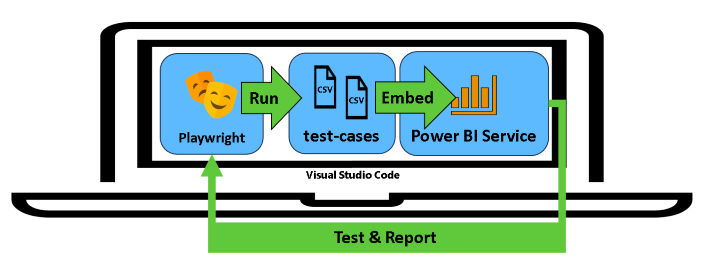 Figure 2 - High-level illustration of testing process with Playwright
And Figure 3 provides an animated gif of the process in action.
 Figure 3 - Lights, Camera, Playwright in Action (yep, full of puns)
Most importantly after the tests are complete, you can see a report of what failed including screenshots of the page (pretty cool!).
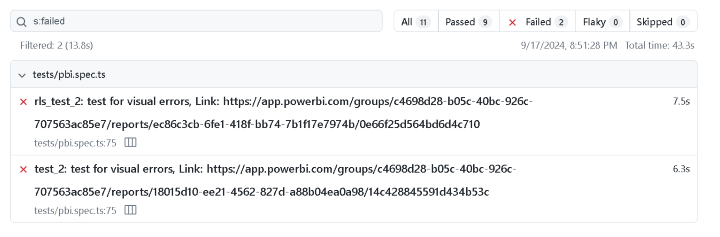 Figure 4 - Example of Playwright Test Results
Sharing with the Audience
Would you like to try it out yourself? Prachiti and I have made it available on GitHub at this link. We walk you through the specific setup steps and what you need to run it on your own machine.
If you’d like to see this in action in person, I’ll be presenting at SQL Saturday Pittsburgh and TechCon365 Dallas in the next couple of weeks.
In my next article, I’ll cover what is required to further automate this process in Azure DevOps… so stayed tuned.
As always, let me know your thoughts on LinkedIn or Twitter/X on the approach and ways to improve it and the documentation.