I need better equipment… that was the first line of my first blog post back in July of 2021. My goal for this blog was to share my experiences (and failures) working with Power BI in order to shed light on features and capabilities we needed to build better data analytic solutions. I had learned about DataOps from Chris Bergh, and I felt that if folks knew how to apply those DataOps principles to their projects it would help their teams build better solutions.
I’m happy to say, I’ve seen lots of progress with Power BI (and now Fabric), thanks to the efforts of the community and leadership of certain Microsoft staff. Community leaders like Mathias Thierbach, Greg Nash, Gerhard Brueckl, Sandeep Pawar, Flávio Meneses, Kevin Arnold, Mike Carlo, Seth Bauer, and Tommy Puglia have done incredible jobs building tools, presenting, and educating folks on topics around version control (Make it Reproducible), testing (Quality is Paramount), and Power BI Deployments (Orchestration).¹ The introduction of Power BI Project (PBIP) and DAX Query View spearheaded by Rui Romano and Zoe Douglas, respectively, is also a welcomed sign that DataOps principles are more ingrained with the tool.
Yet, adopting DataOps requires you to shun complacency and look to improve while prioritizing those improvements based on their impact. That impact can be measured by your ability to deliver quicker features and reducing errors. With that said, there is lots of work that still needs to be done to improve, and I’d like your help. Below is a list of ideas that, I believe, would improve our delivery of data analytic solutions. Not all ideas are my own and I will try to mention where I heard that idea or insert a link to their idea. These ideas are categorized in the lens of several DataOps principles: Make it Reproducible, Quality is Paramount, Monitor for Quality and Performance, Analytics is Manufacturing, Improve Cycle Times and Orchestrate. Please note that my thoughts on Power BI/Fabric are only intended as constructive criticism.
Each idea has a link to Fabric ideas where you can vote to support the idea. The more votes, the more Microsoft recognizes them as priorities.
Make it reproducible
Reproducible results are required and therefore we version everything: data, low-level hardware and software configurations, and the code and configuration specific to each tool in the toolchain.
This principle emphasizes version control. As I explained in my DataOps 101 sessions, version control is the first step to making analytic projects more successful.
1) Power BI Desktop Direct integration with Git
As I summarized back in my first article, Power BI has a huge challenge in bridging the gap between high-code best practices with low-code practitioners. PBIP’s introduction into the product is wonderful but having folks install Git and Visual Studio code, and then learn the process of committing and syncing is still daunting for many. These Git interactions could be abstracted by having Git integration built into Power BI Desktop. Yes, Git Integration is built into the workspace experience but most people I work with are still using Desktop. A simple interface (GitHub Desktop is a good example) along with templated branching strategies would go a long way in making the adoption of version control more seamless.
 Figure 1 - Illustration of Idea for Power BI Desktop Direct Integration with Git
2) Add a license model for Power BI that integrates Azure DevOps
There is a major disconnect between getting an Azure DevOps project started and figuring out the license models. With many large organizations, you are dealing with two different departments with different processes and goals (and bosses). This creates a natural obstacle that many see as arduous and therefore take the path of least resistance (no version control, or SharePoint/OneDrive which is limiting). A license type that would automatically create a project for a workspace could make adoption easier.
Quality is Paramount
Analytic pipelines should be built with a foundation capable of automated detection of abnormalities and security issues in code, configuration, and data, and should provide continuous feedback to operators for error avoidance.
Test, test, and test. This principle emphasizes the importance of implementing testing regimes for semantic models, reports, dataflows, and other artifacts in Power BI/Fabric.
3) Build Tests via UI/Low-Code
With the introduction of DAX Query View, building tests that are coupled with the Power BI files are a wonderful capability. However, writing DAX can be hard and may feel like a bridge too far to write DAX that tests your model. Why not have the DAX written for us by an interface that set checks like:
- Column Expectations – Ability to use comparison operators (e.g., greater/less than, not null, regex, is in).
- Schema Expectations – Ability to validate primary keys and the names and types of the columns in tables.
- Content Expectations – Ability to validate row counts with operators (e.g., greater/less than, equal, group by).
- Measure Expectation – Ability to validate DAX measures under certain filters/conditions.
At present we must use tools like Performance Analyzer to generate DAX or Quick Queries in DAX Query View to generate statistics and copy those values. A smoother user experience would improve the adoption of testing.
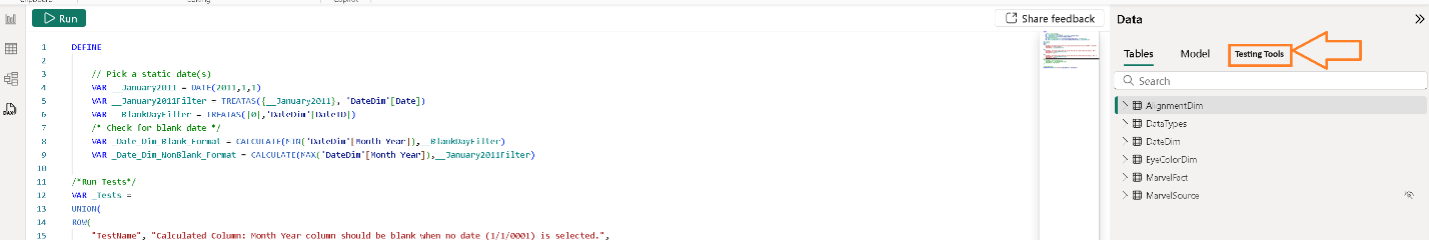 Figure 2 - Imagine if we could build tests through a UI in DAX Query View?
4) Automated Checks to Avoiding the “Grey Box of Death” in reports
One of the fears that all seasoned data practitioners working with Power BI solution has, is making an update to a semantic model and getting that call/message that a visual has broken. A broken visual, “grey box of death”, is the most visible representation of your project team’s mistakes in development and a problem that can lead customers to lose confidence in your work. Best practices in the industry drive us to separate reports from the model; however, while we may know what reports are impacted when we publish, we do not know if those impacts are good or bad. In the past my teams have had to use Selenium or automate Avi Ulman’s idea to test for broken visuals. I would be willing to pay a little extra if this check was automated for me, and I would be aware of an issue when I publish via desktop or via deployment pipelines.
 Figure 3 - If we could automatically check for the “Grey Box of Death” in Power BI… what a world!
Note: I’ll have articles later this year on this topic and provide free templates using Microsoft Playwright with Azure DevOps.
5) Accessibility Checker
Meagan Longoria, Stephanie Bruno, and Shannon Lindsay have spoken on this issue for several years, and the checklists and tools they have built, respectively, spreadhead the efforts to bring accessibility to Power BI Reports. If our reports have tab orders that make a screen-reading chaotic, slicers that all have the same title, or foreground-background color contrasts that do not factor in color blindness, we are not servicing our audiences; moreover, these issues can be in violation of government law (e.g., Section of 508 of the U.S. Rehabilitation Act of 1973). From personal experience, building Power BI reports that are more accessible results in better quality reports for all audiences. Power BI reports sorely need a built-in Accessibility checker to help us all build reports of better quality.
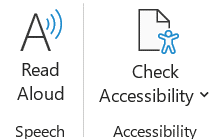 Figure 4 - I look forward to a day where these buttons exist in Power BI Desktop
Monitor for Quality and Performance
Our goal is to have performance, security, and quality measures that are monitored continuously to detect unexpected variations and generate operational statistics.
This principle underscores the importance of treating data pipelines as a manufacturing line, emphasizing the need to check the status at every step in the process to catch errors before they reach the customer.
6) Monitor Hub – Built in Dataset and Dataflow Common Issues
A centralized station, the Monitoring Hub enables viewing and tracking activities across various products. For new Fabric artifacts such as Notebooks, it provides granular information on the health and operation specifics. However, the information is still quite high-level for datasets and dataflows.
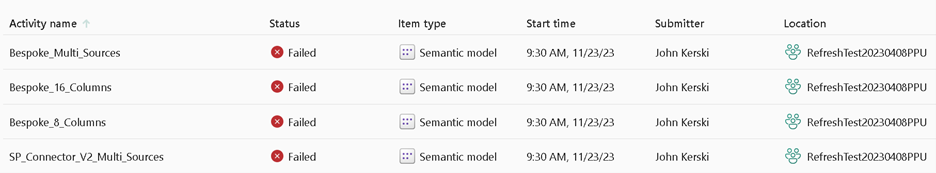 Figure 5 - Forget the emails, a Monitoring Hub that helps Workspace Administrators deal with common issues would be huge.
I think the Monitoring Hub should allow workspace administrators to see common issues that arise, such as:
- Datasets and Dataflows with recently disabled schedules
- Datasets and Dataflows with conflicting schedules
- Apps with pending access requests
- Datasets and Dataflows with invalidated credentials
Analytics is manufacturing:
Analytic pipelines are analogous to lean manufacturing lines. We believe a fundamental concept of DataOps is a focus on process-thinking aimed at achieving continuous efficiencies in the manufacture of analytic insight.
This principle emphasizes the need to improve how we build our data pipelines and deliver our model and reports to customers. If we are slowed down by manual processes or data pipelines that are brittle and break easily, we should look for ways to optimize these processes and make our data pipelines more resilient.
7) Power Query Support for Azure Key Vault
With Power Query’s Web.Contents lack of support for POST requests using OAuth or other credentials, the default for many is to store keys or secrets in Power Query hard-coded. This adds a burden on the teams to secure the Power Query code, and increases the overhead on teams to ensure that data pipelines we build with Power Query are secure and won’t be comprised. If we could use key vault references much like you can in Azure App Service and Azure Functions within Power Query, our API keys would be protected resulting in a huge win for the security of our solutions.
Improve Cycle Times
We should strive to minimize the time and effort required to turn a customer’s need into an analytic idea, create it in development, release it as a repeatable production process, and finally refactor and reuse that product.
Time spent on long-running or inefficient processes delays our ability to deliver solutions to customers, preventing them from achieving their objectives in a timely manner or missing those objectives entirely.
8) Power Query IntelliSense/Gen AI for Comments and Variable Names
Often when trying to understand the Power Query code built by others, Power Query’s default step names provide little context. You must hunt-and-click your way through steps to find that exact column… crack open the code in advanced editor, copy the code to a text editor and search (especially if the number of steps is a lot). The time spent understanding what Power Query steps are doing can result in a significant time investment. That time investment leads to slower delivery to customers and poor maintenance. This is the antithesis of DataOps.
With the advancement of models within Co-Pilot or even Phi3, this product should provide the ability to (1) suggest comments to add to an applied step, (2) rename the applied step to something with better context and (3) add comments to custom functions.
Note: I have presented an interim solution to this if you are interested.
9) Support for Custom Connectors in Dataflows
Dataflows are a great way to standardize data transformations and avoid teams from having to recreate transformation logic or copy Power Query code from other semantic models. Many APIs (including those with OAuth2) require custom connectors and the continued lack of support for custom connectors in dataflows stymies’ efforts to reuse logic and adds more overhead to teams to deliver solutions. While I see this may come in Quarter 1 of 2025, it was also advertised in a roadmap for Quarter 3 of 2023. Therefore, I will keep this idea firmly planted on this list.
Orchestrate
The beginning-to-end orchestration of data, tools, code, environments, and the analytic team’s work is a key driver of analytic success.
Automating orchestration through Continuous Integration and Continuous Deployment (CI/CD) is essential for delivering analytics to customers swiftly while mitigating the risks of errors.
10) Fabric Deployment Pipelines - Features from Pipelines in Power Platform
Over the past year, I’ve been able to work with both Pipelines in Power Platform and Fabric Deployment pipelines. Pipelines in Power Platform (PPP for short) can move solutions through development, test, and production environments (Power BI’s idea of a workspace roughly) and these solutions can contain items like Power Automate flows and PowerApps forms. Fabric Deployment Pipelines (FDP) allow you to move artifacts (i.e., Semantic Models and Reports) through development, test, and production workspaces. After working with both, I have a wish list of what Fabric Deployment Pipelines could look to their fellow product suite to for ideas:
Environment Variables - PPP has a wonderful feature to set variables that can be reused across other products and can be promoted through development, testing, and production. This promotes reuse and consistency. It would be a huge benefit if with FDP I could have variables treated like an artifact and be able to reference them when setting parameter rules in deployment pipelines (like I can with PPP). The introduction of Environments in Fabric scratches at the surface, yet doesn’t quite hit the mark of what PPP can do.
Connection References - PPP allows us to couple connection settings (i.e., SharePoint or SQL) and move those through the environments, change when deployed to a new environment, and reuse across the products. Right now, Power BI gateways are the only way to accomplish this level of reuse and consistency, but you add the overhead of gateway provisioning and server management that you do not have with PPP.
Dependency View – While the lineage view in Fabric is helpful, the way PPP displays “Uses” and “Used By” is in a format that makes it much easier to manage promotions, especially when dependencies get more complicated. Fabric could replicate this feature and allow users to understand the dependencies before promotion including those that exist across workspaces.
Versioning - PPP automatically increments versions of your products/solutions during deployments which makes comparing differences between development, test, and production easier. In Fabric, my teams must often shoehorn semantic versioning into the various artifacts in order to keep track of deployments.
The introduction of these features could go a long way in making the DataOps principles of Orchestration and Reuse easier in the Fabric product.
Conclusion
10 ideas seem like a nice round number for now, so if any of these ideas interest you, please vote them up. Did I miss an idea that would better help weave DataOps into Microsoft Fabric? Let me know what you think either on LinkedIn or Twitter/X .
¹This list is not a complete list and is based on a list of folks that I have personally seen present, or used their tools, so if you’re reading this and wondering why I did not mention you or someone else, my apologies. Thank you for your support in this area.