Weaving DataOps into Microsoft Fabric – Logging Test Results to OneLake
In my last article, I reviewed how to automate testing in an Azure DevOps pipeline providing continuous integration and continuous deployment for your teams using the PBIP Deployment & DAX Query View Testing Pattern. I’d like to continue that discussion and focus on the DataOps principle of “Reflect”.
Reflect: Analytic teams should fine-tune their operational performance by self-reflecting, at regular intervals, on feedback provided by their customers, themselves, and operational statistics.
DataOps emphasizes the importance of setting time aside to allow teams to address where they can improve their development and testing processes. Seeing that Agile is a key part of DataOps, a retrospective is an appropriate time for teams to reflect on their past work and identify areas where the team can improve.
In the past when I worked with Azure DevOps, the out-of-the-box features and operational statistics provided were helpful, but what if our teams want to fine-tune their work with more granular questions like:
Are we seeing an increase or decrease in the number of failed tests in the pipeline?
Which team members are having more failed tests in the pipeline lately?
What are the total tests running per semantic model and has that number increased or decreased over time?
The challenge was that while Azure DevOps can provide some of this data, I need to be able to combine this with other data sources in order to help me analyze development and testing operations. Now, what product do I know can do that… hmmm…? All jokes aside though, Fabric could help. More specifically, OneLake provides this capability.
The Approach – PBIP Deployment & Data Quality View Testing Pattern with Log Shipping
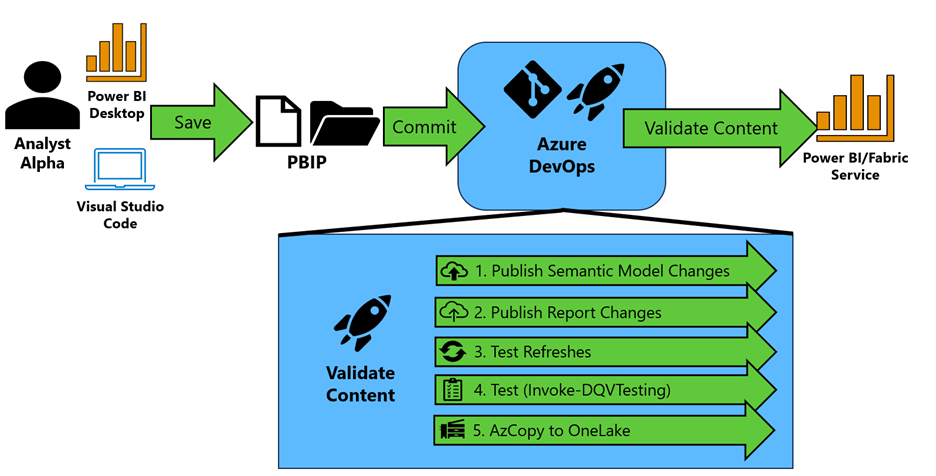 Figure 1 - High-level approach
In the pattern depicted in Figure 1, your team saves their Power BI work in the PBIP extension format and commits those changes to Azure DevOps.
Then an Azure Pipeline is triggered to validate the content of your Power BI semantic models and reports by performing the following:
The semantic model changes are identified using the “git diff” command. Semantic models that are changed are published to a premium-backed workspace using Rui Romano's Fabric-PBIP script. The question now is, which workspace do you deploy it to? I typically promote to a Build workspace first, which provides an area to validate the content of the semantic model before promoting to a development workspace that is shared by others on the team. This reduces the chances that a team member introduces an error in the Development workspace that could hinder the work being done by others in that workspace.
With the semantic models published to a workspace, the report changes are identified using the “git diff” command. Report changes are evaluated for their “definition.pbir” configuration. If the byConnection property is null (meaning the report is not a thin report), the script identifies the local semantic model (example in Figure 2). If the byConnection is not null, we assume the report is a thin report and configured appropriately. Each report that has been updated is then published in the same workspace.
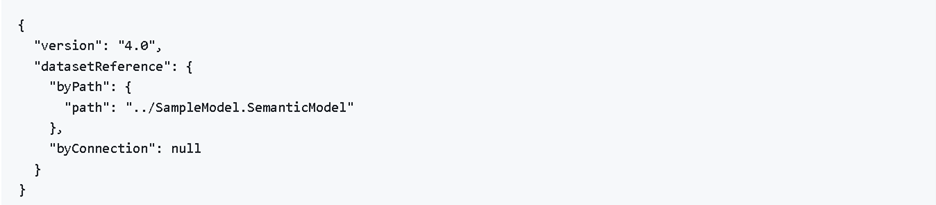 Figure 2 - Example of. pbir definition file
For the semantic models published in step 1, the script then validates the functionality of the semantic model through a synchronous refresh using Invoke-SemanticModelRefresh. Using the native v1.0 API would be problematic because it is asynchronous, meaning if you issue a refresh you only know that the semantic model refresh has kicked off, but not if it was successful. To make it synchronous, I’ve written a module that will issue an enhanced refresh request to get a request identifier (a GUID). This request identifier can then be passed as parameter to the Get Refresh Execution Details endpoint to check on that specific request’s status and find out whether or not the refresh has completed successfully.
If the refresh is successful, we move to step 4. Note: The first time a new semantic is placed in the workspace, the refresh will fail. You have to “prime” the pipeline and set the data source credentials manually. As of April 2024, this is not fully automatable and the Fabric team at Microsoft has written about it.For each semantic model, Invoke-DQVTesting is called to run the DAX Queries that follow the DAX Query View Testing Pattern. Results are then logged to the Azure DevOps pipeline (Figure 3). Any failed test will fail the pipeline.
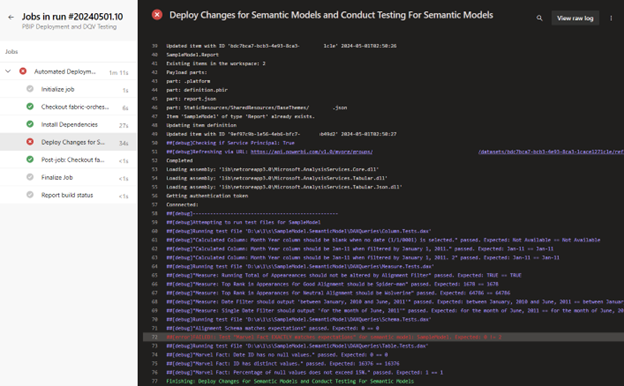 Figure 3 - Example of test results logged by Invoke-DQVTesting
Thanks to Inderjit Rana’s recent article on Ingest Data into Microsoft Fabric OneLake using AzCopy, the results of the tests collected by Invoke-DQVTesting are also sent to OneLake where they reside in a Lakehouse on your Fabric Capacity. These can then be used for processing, analyses, and notifications.
Note: The build agent requires AzCopy to be pre-installed. AzCopy is installed by default for Microsoft-host agents in Azure DevOps.
In practice
Do you want to try it out for yourself? I’ve written step-by-step instructions on implementing the pattern with Azure DevOps at this link. Please pay close attention to the prerequisites so your workspace and tenant settings can accommodate this pattern.
Notebook
In addition, my GitHub repo has a sample Fabric notebook (see Figure 4) and instructions that you can use as a starting point for processing and loading the data into your Lakehouse. Special thanks to Sandeep Pawar and his excellent blog that helped me develop this notebook.
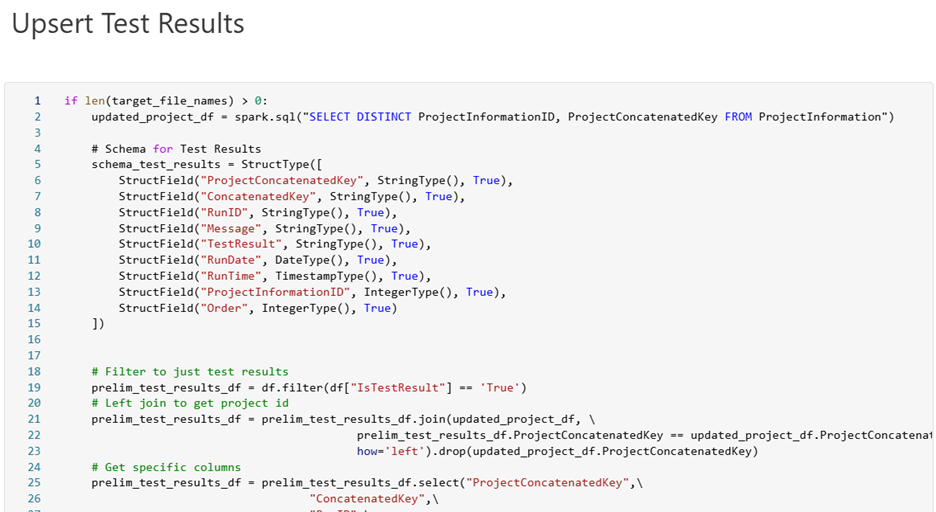 Figure 4 - Screenshot of Notebook to Assist with Processing Test Results and Inserting into Delta Tables.
As always, let me know your thoughts on LinkedIn or Twitter/X on the approach and ways to improve it.